
Key Findings:
A layout-only change, switching from per-order to per-date folder structure, reduces end-to-end ingestion time from 71 hours to 49 minutes on identical production data, with no changes to payloads, schemas, or ingestion code. Replacing JSON webhooks with Kafka-fed batched Parquet reduces storage footprint by 8×, query latency by 6×, and recovery time from up to 45 minutes to under 8 minutes. Both gains are produced entirely by producer-side decisions about how events are laid out and delivered, not by tuning on the consumer side.
Partition Layout and Discovery Cost
BI reliability is a producer-side property. The central question this paper answers is: why does BI ingestion time grow faster than data volume, and which interventions fix it?
Event-driven analytics pipelines that land one small JSON object per event under a per-entity directory share a recurring property: the cost of finding new files grows linearly with the population of distinct entities, while the cost of processing new files grows linearly with the rate of new data. The two are independent, and at scale the discovery cost dominates.
There is nothing new in the mechanics. Incremental ingestion tools such as Databricks Auto Loader, Hive metastore-driven listings, and Spark Structured Streaming over directories all need to enumerate prefixes to find out which files are new. Each enumeration is a network call against a key-value listing service. Each call has a small but non-zero latency. When the directory tree puts one folder per business object, the number of those calls scales with business volume rather than with how much new data has arrived. The layout is fine on day one and degrades gracefully, but at a few million distinct objects the listing budget alone exceeds the ingestion window.
Discovery cost is the time spent enumerating which files are new, independent of how much data has actually arrived.
The pattern in EVA's BI lake. EVA emits 33 business event types via JSON webhooks. The events land in Azure Blob Storage and are ingested into Delta tables on Databricks via Auto Loader. The export layout in production today is: `/EVA/euw/orders/<order id>/<year>/<month>/<day>/*.json` which has three properties relevant to the pattern above:
- One folder per object. Order count and folder count are identical: a 20-day window produces 2,576,830 folders.
- Recursive discovery. Auto Loader walks the prefix tree rather than performing a single bulk listing, so it issues a listBlobs call per prefix to detect new files.
- Per-Order-ID partitioning. The Delta table partition column is the order ID, so partition pruning is effectively a per-row operation rather than a coarse filter.
The downstream effects follow directly from those three properties, and apply to any pipeline with the same shape:
- Discovery becomes the bottleneck. At Azure's published LIST SLA of 40 ms (measured average ≈100 ms on our account), serial discovery of 2.58M folders takes 28.6h–71.6h, depending on which latency you assume, before a single JSON record is parsed.
- Any metadata-only change (a permissions sweep, a re-tag) triggers a full prefix re-walk.
- Operational alerts can become dominated by "slow CloudFiles discovery" signals rather than by genuine data issues.
- Pipeline cost grows linearly with order count and is largely decoupled from the volume of new data.
In practice this shows up as variance more than as slowness. The same job can take 6 hours one night and 30 hours the next, depending on the listing rates the object store gives us at the time. For a BI lake whose downstream consumers expect a fixed daily window, the discovery cost needs to be predictable, and at the moment it is not.
The rest of the paper presents two experiments that address this problem at two different layers of the pipeline. Experiment 1 (Section 3) is a layout-only change applied to a real production data set: we rewrite the export's prefix structure and time the resulting ingestion against the original layout, with no other modification. Experiment 2 (Section 4) is a deeper producer-side change: events are routed through Kafka and aggregated into batched Parquet files at the source, written by a Rust consumer we built for this purpose. The implementation that underpins Experiment 2 is documented in Section 5, and the reliability properties that follow are discussed in Section 6.
The Producer-First Reliability Model: Why BI Reliability Starts at the Producer
We test two interventions, applied in sequence. Together they form what we call the Producer-First Reliability Model: the principle that BI reliability is set upstream, by decisions about how events are laid out and delivered, not downstream by ingestion tuning.
Intervention A: Date-partitioned layout (drop-in). Change the export path from per-order folders to per-date folders for the BI mirror. Same files, same payloads, same Auto Loader code: /export/orders/<year=2025>/<month=07>/<day=15>/*.json
Intervention B: Kafka fan-out and batched Parquet. Replace the JSON-webhook bottleneck with a Kafka topic per object type. A dedicated batch-writer consumer accumulates events into Snappy-compressed Parquet files (256–512 MiB targets) at a Hive-partitioned path of the form /events/$topic/yyyy/mm/dd/hh/mm/, while an Auto Loader stream loads them into Delta tables in Unity Catalog. Webhook endpoints stay operational for downstream integrations; analytics opt into the Parquet pathway.
Intervention A is a layout change we can ship today. Intervention B is the strategic end-state. We measure A directly and validate B over a 30-day pilot.
Experiment 1: How Date Partitioning Cuts Databricks Ingestion Time by 87×
Setup
We took the BI lake's current orders blob set, copied every file to a new container, and rewrote the prefix structure from: orders/<order id>/<year>/<month>/<day>/
to: orders/<year>/<month>/<day>/
No payload, schema, or Auto Loader configuration was modified. We ran the same backfill loop on the same Databricks cluster:
df.write \
.format("delta") \
.option("mergeSchema", "true") \
.option("overwriteSchema", "true") \
.mode("overwrite") \
.partitionBy("event_date") \
.saveAsTable(table_name)
Table 1: Experiment 1 dataset and infrastructure parameters.
Parameter | Value |
|---|---|
Window | 25.06.2025 – 15.07.2025 (20 days) |
Orders count | 2,576,830 |
Files count | 0,307,261 |
Folders before (per-order) | 2,576,830 |
Folders after (per-date) | 20 |
Azure LIST SLA | 40 ms |
Azure LIST measured average (old) | 100 ms |
Azure LIST measured average (new) | 500 ms† |
† Per-call latency rises in the new layout because each call returns a much larger page; the cumulative discovery cost falls anyway because we issue ∼105 fewer calls.
Results
Table 2: Experiment 1 - discovery and ingestion time, measured on the same cluster, same code, same data.
Phase | (A) Per-order | (B) Per-date | Speed-up |
|---|---|---|---|
File discovery | ≈71.6 h | ≈2 min | ≈2,100× |
Schema inference | not separable‡ | 46 min | n/a |
Delta write | not separable‡ | 0.01 min | n/a |
End-to-end | ≈71 h | 49 min | ≈87× |
‡ In the per-order run discovery dominates so heavily that schema and write phases never reach steady state under our typical job timeout window.
The discovery curve in the per-order layout is the textbook "flat then exponential-looking" shape of a recursive metadata walk: latency is linear in folder count, and folder count is linear in business volume. In the per-date layout it is a clean line: cumulative discovery time grows ≈5 s per added daily folder.
Figure 1 shows both curves at their respective scales.
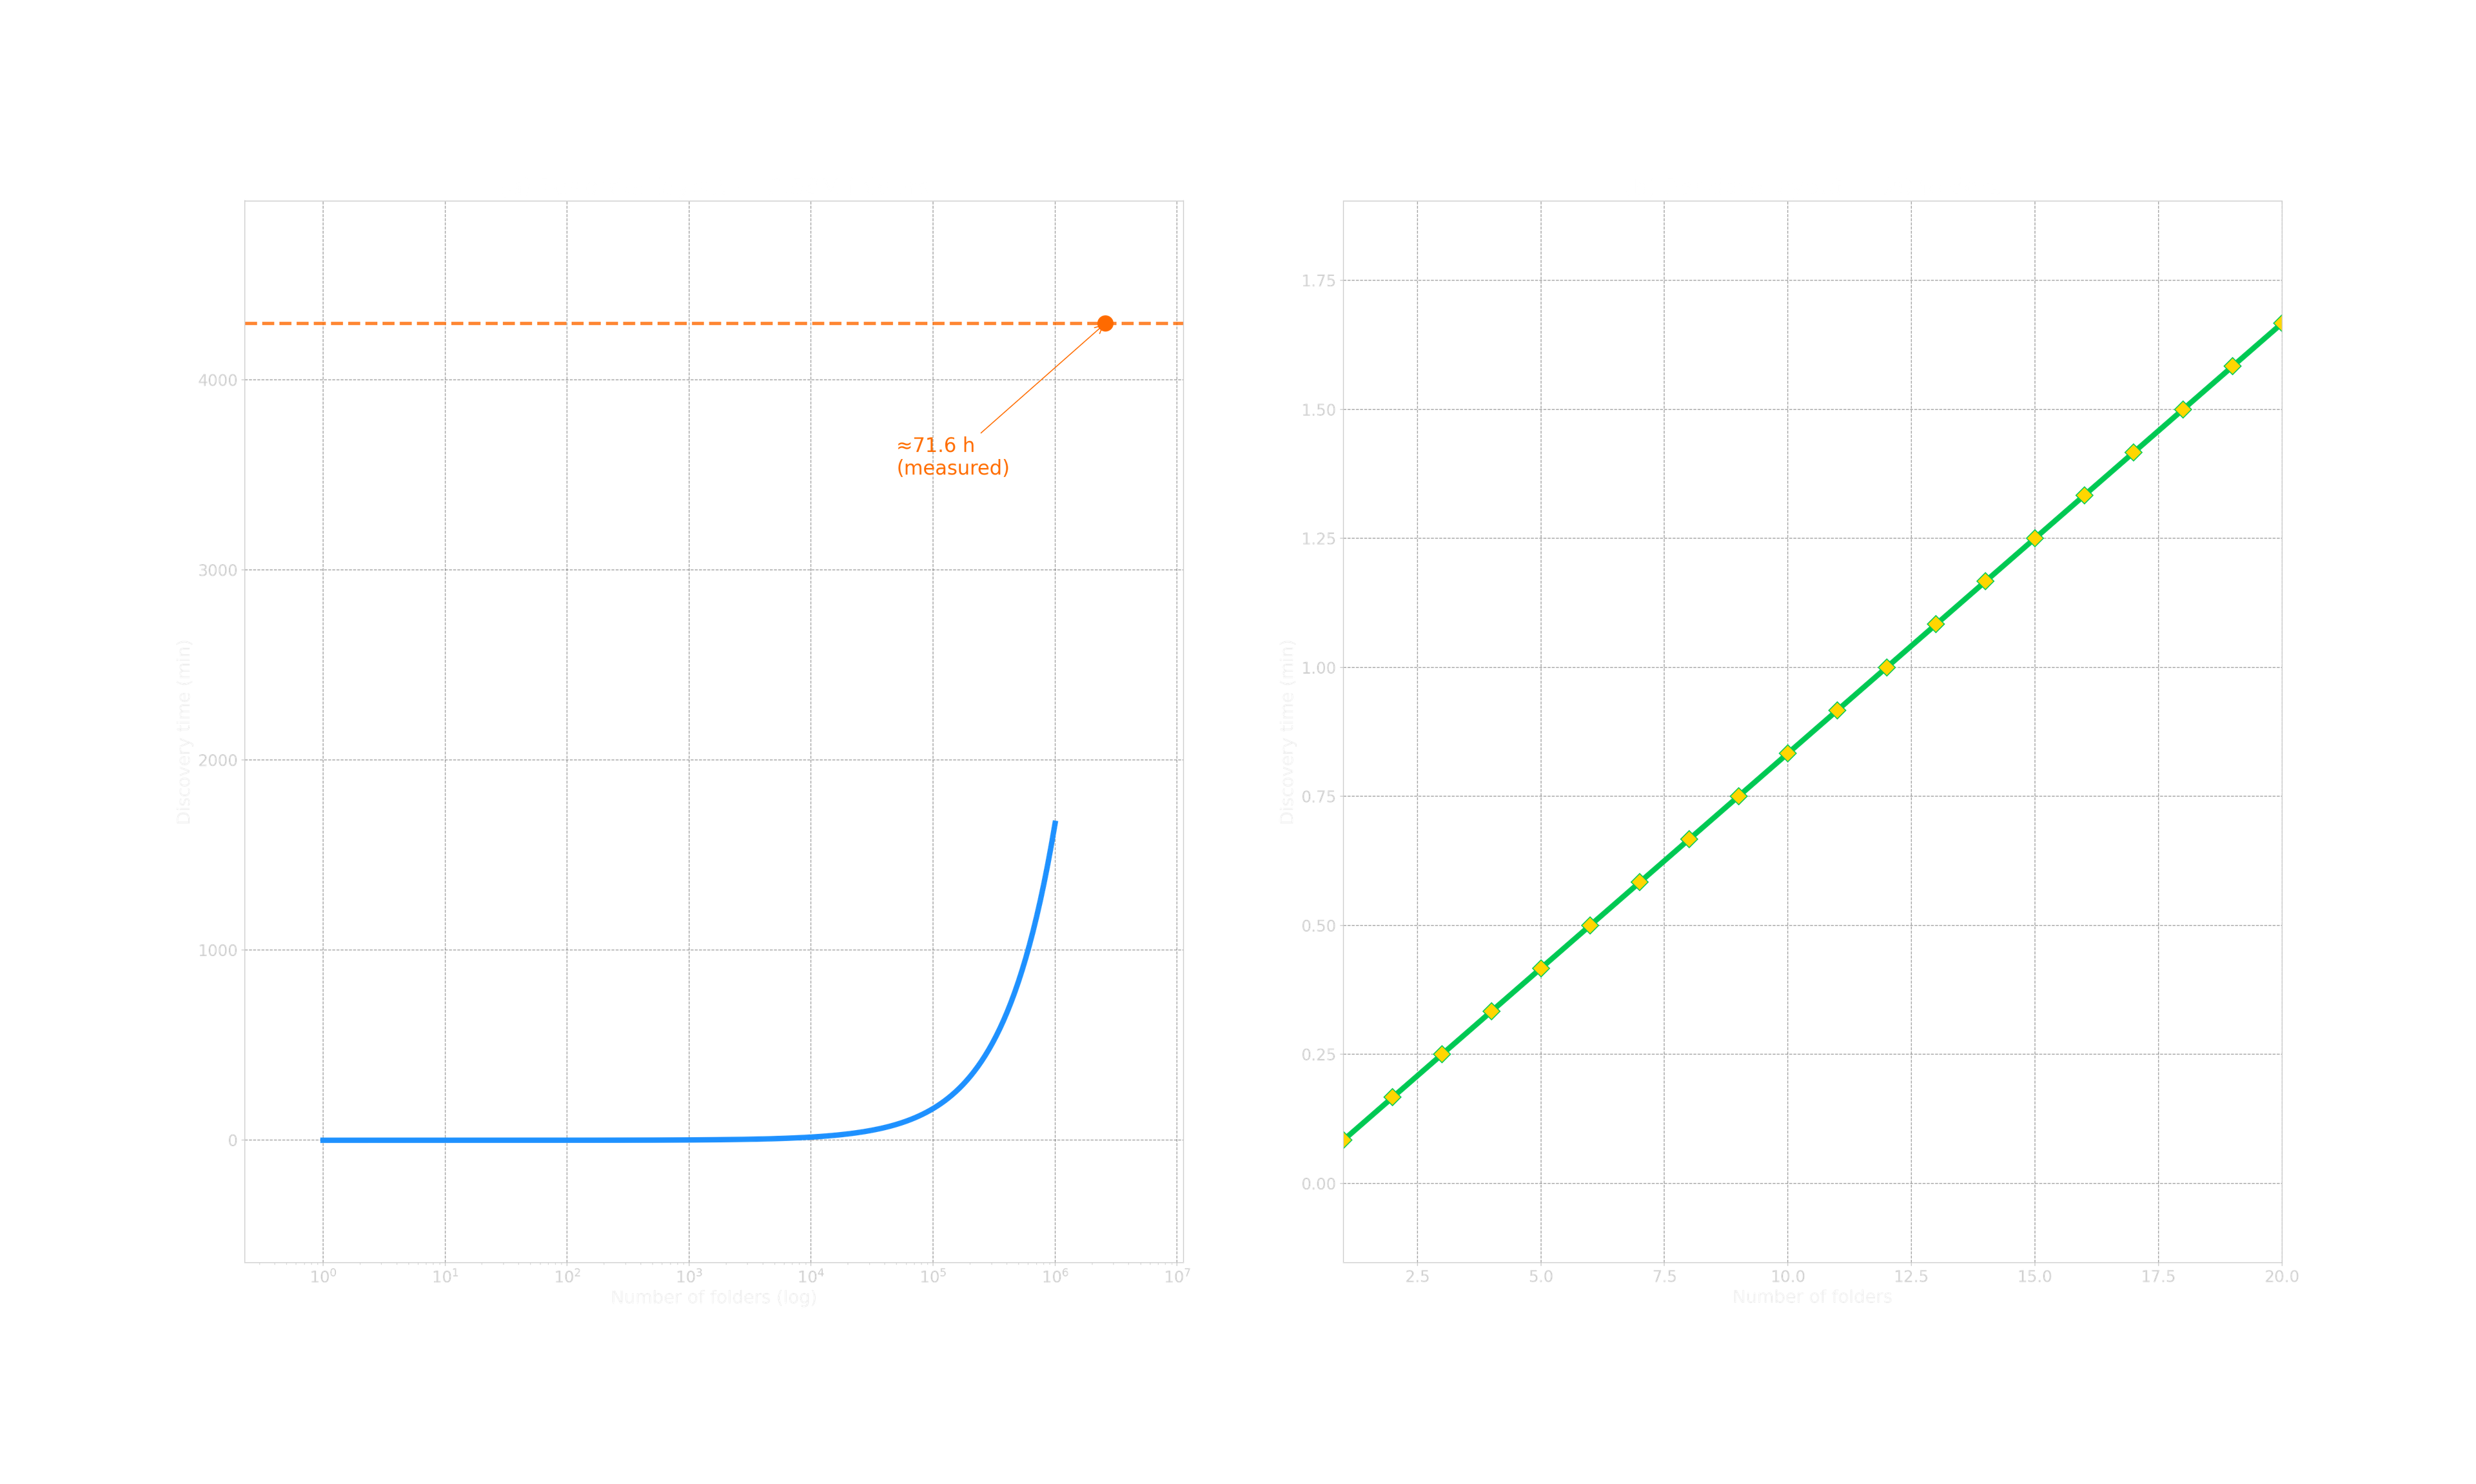
Figure 1: Discovery time as a function of folder count. (a) Per-order layout: 100 ms measured average per listBlobs call × 2.58M prefixes → ≈71.6 h. (b) Per-date layout: 20 daily folders, dominated by a small number of paginated calls per folder, end state ≈1.7 min. Note the different x-axis scales.
Figure 2 re-frames the same result in terms of the end-to-end run, decomposed into the three pipeline phases.
Note that the x-axis is logarithmic: the per-order run is two orders of magnitude longer than the per-date run, and that gap is entirely accounted for by discovery.
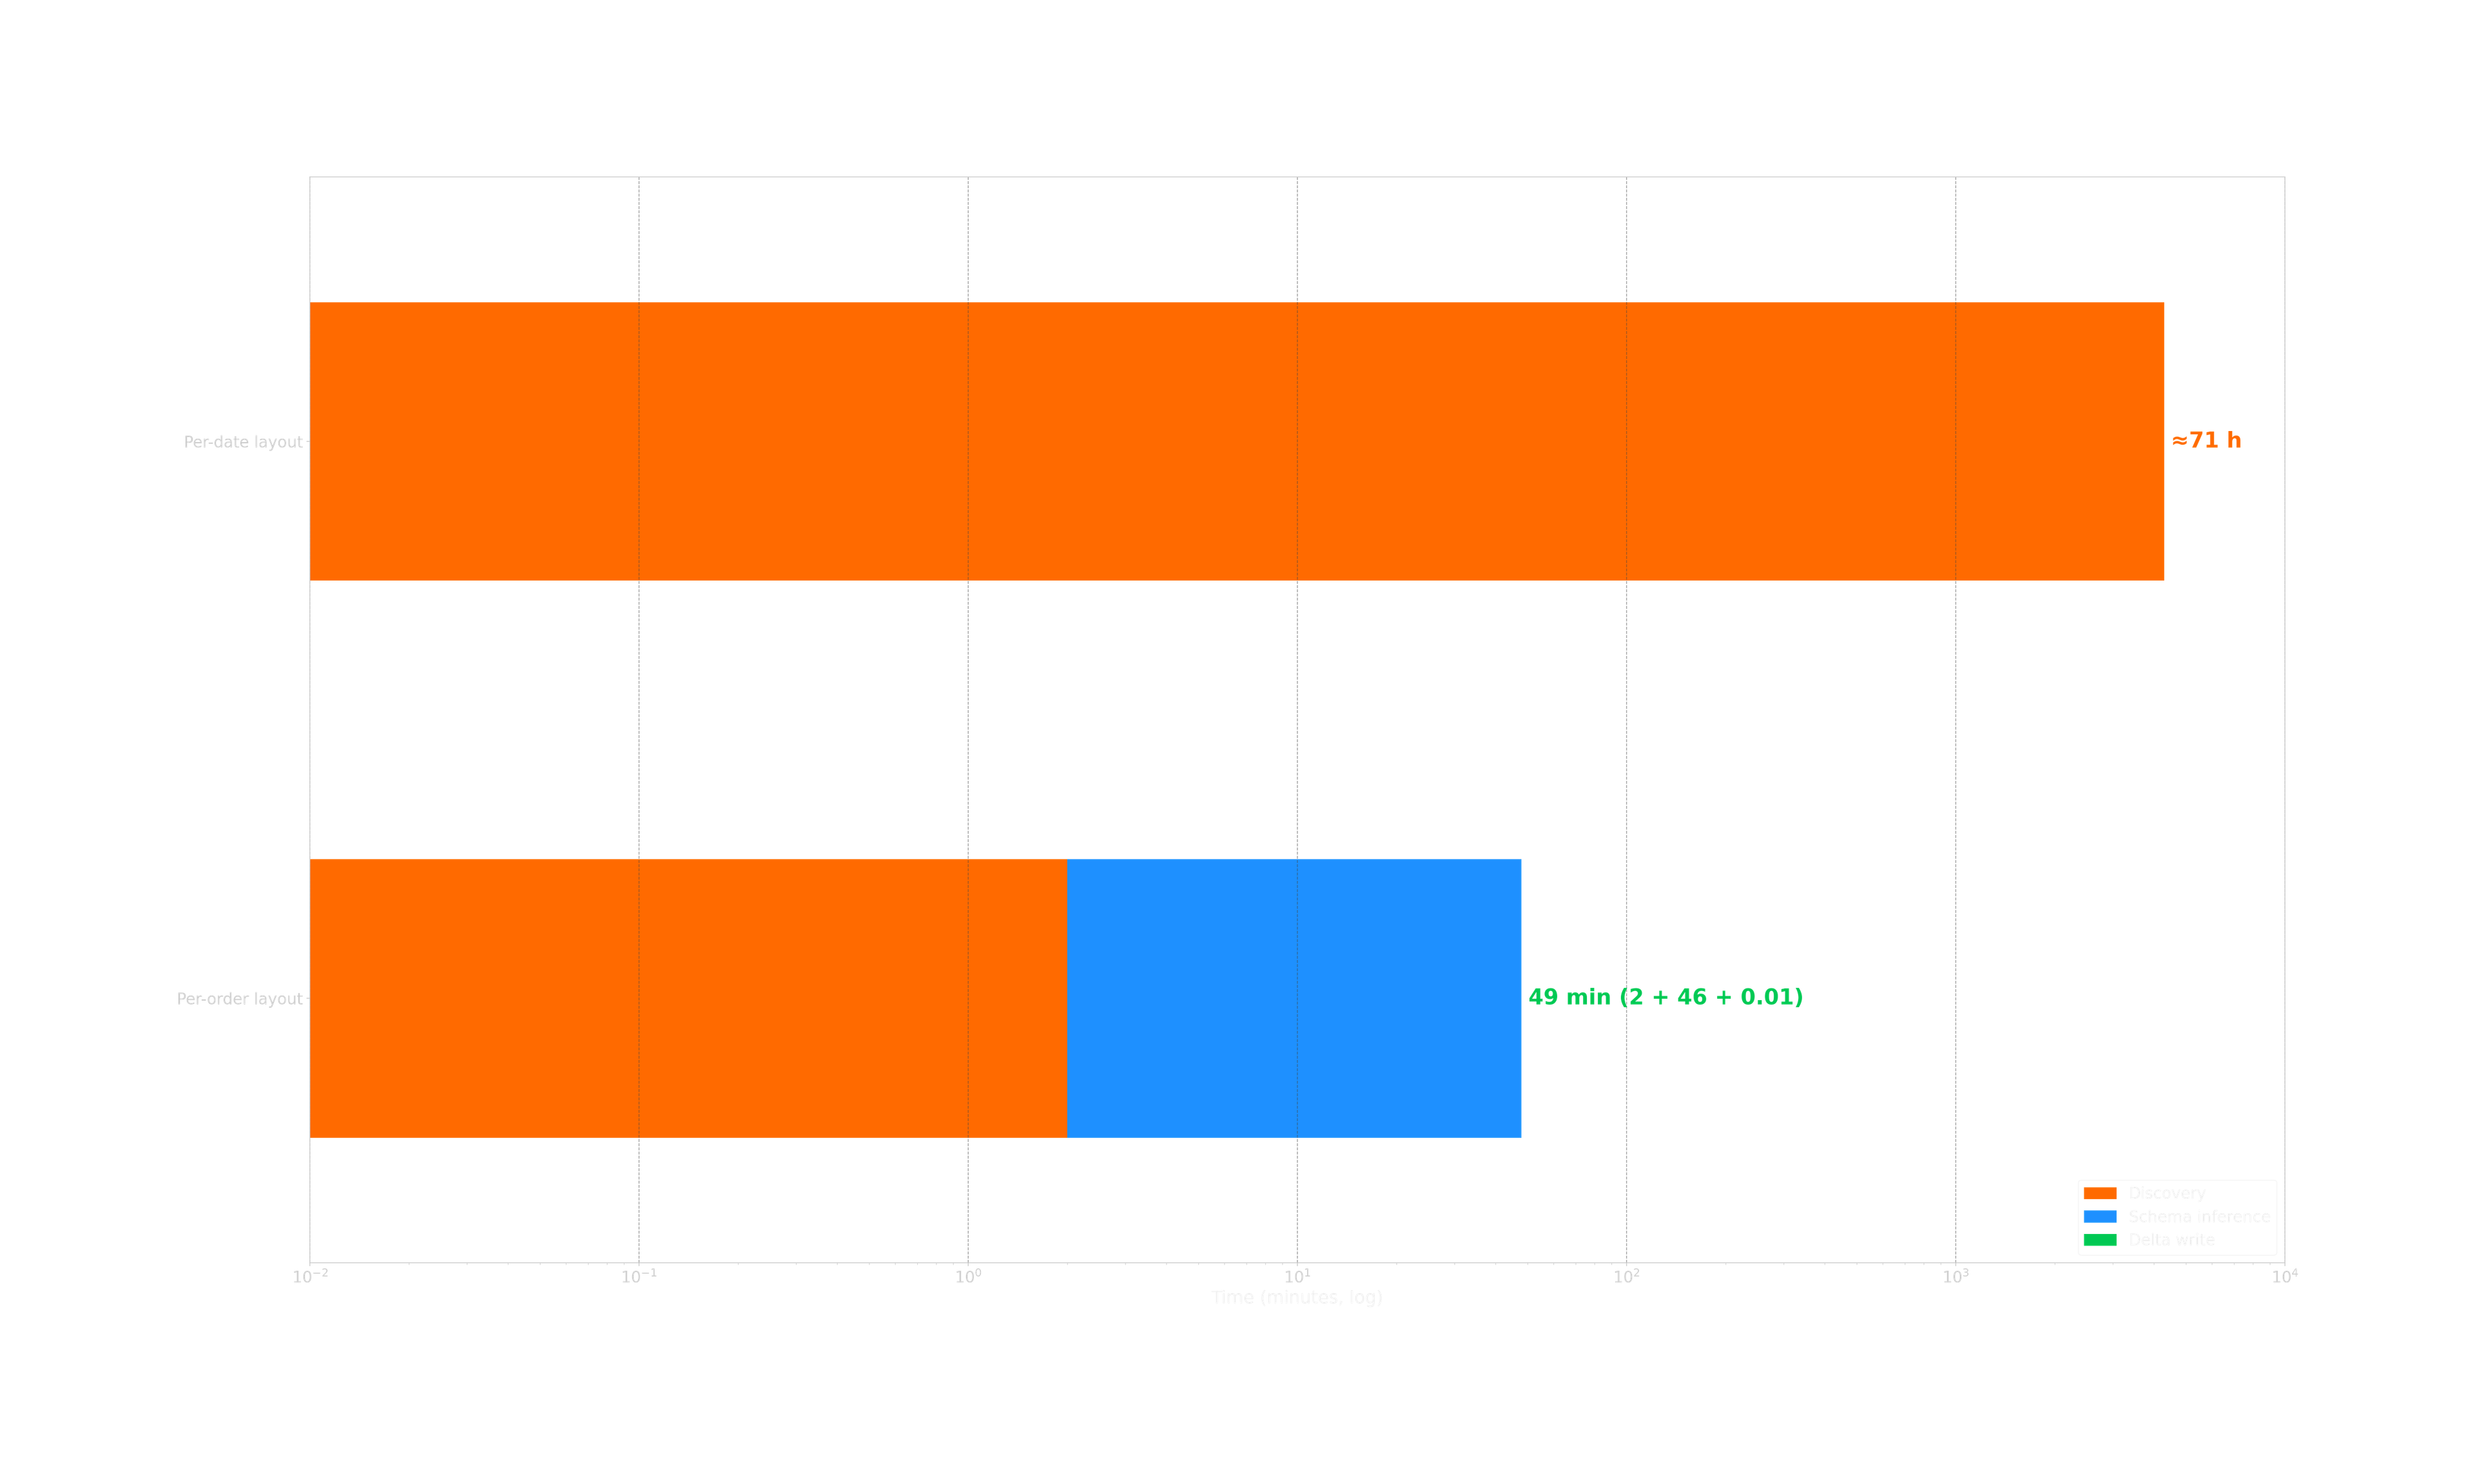
Figure 2: End-to-end ingestion time, decomposed by phase. The per-order run is dominated by discovery to the point that schema inference and the Delta write are not separately observable within a typical job window. The per-date run finishes in 49 minutes, of which the actual Delta write takes less than a second.
What This Means in Steady State
The relevant question is not "how fast was the backfill" but "what is the cost-of-running per scheduled run." With the BI lake today we run the ingest 4× daily. Treating discovery as the bottleneck and using Azure's 40 ms LIST SLA as the floor:
- Per-run discovery, per-order layout: 28.6 h (≈1,716 min)
- Per-run discovery, per-date layout: 1.68 min
- Per-run reclaimed driver time: ≈28.57 h
- Per day (4 runs): 114.3 driver-hours
- Per 30 days: ≈3,430 driver-hours
Discount these numbers heavily for parallelism if you like. The shape of the result still holds: most of the BI compute today is spent finding files, and re-partitioning removes that work.
Experiment 2: Kafka-Fed Parquet vs. JSON Webhooks: 30-Day Benchmark Results
Setup
The second experiment evaluates the strategic end-state. We ran it in our internal development and test environment. That environment is not a like-for-like replica of production, so the absolute numbers below should be read as a design-validation exercise rather than as a certified benchmark. We expect the shape of the results to carry over to production. The exact magnitudes will depend on the production hardware and network setup.
- Azure Standard D4s v3 instances for the EVA services under test
- Apache Kafka cluster, 3 brokers, replication factor 3
- Databricks workspace with Delta Lake on Unity Catalog
- 10M daily events across 33 EVA event types (synthetic load shaped from production traffic patterns)
- 30 days of continuous operation, with controlled load injection reproducing peak / off-peak / catch-up regimes
The JSON-webhook baseline ran on the same hardware against the same source streams. Both pipelines were fed from a single tee inside the test environment to ensure identical input.
Headline Results
Table 3: Experiment 2 - 30-day production-representative comparison.
Metric | JSON | Parquet | Improvement |
|---|---|---|---|
Storage footprint (GB) | 2,400 | 300 | 8.0× |
Export throughput (events/s) | 450 | 2,250 | 5.0× |
Ingestion latency (min) | 180 | 45 | 4.0× |
Query latency (s) | 120 | 20 | 6.0× |
Error rate | 0.8% | 0.05% | 16× |
Recovery time per failure | 15–45 min | 3–8 min | 5× |
The 8× storage reduction comes almost entirely from columnar compression: dictionary encoding on customer / product IDs, run-length encoding on sparse boolean fields, and Snappy block compression. The 5× throughput improvement is amortisation: a single POST that delivers 250,000 events instead of one.
Why the Improvement Holds at Scale
Network I/O dominates the per-event cost in the JSON path, and is precisely the line item that batching eliminates. This matters for BI because it removes the "small-file problem" from the data lake at source: we no longer need a separate compaction job to make the lake queryable.
Table 4: Per-event latency by stage. Parquet figures are batched amortised.
Component | JSON (ms) | Parquet (ms) | Improvement |
|---|---|---|---|
Event serialization | 2.30 | 0.12 | 18.2× |
Network I/O | 47.8 | 0.94 | 50.9× |
Storage write | 8.10 | 0.31 | 26.1× |
Schema validation | 1.20 | 0.08 | 15.0× |
Error handling | 3.40 | 0.15 | 22.7× |
Total per event | 62.8 | 1.60 | 39.3× |
Figure 3: Per-event latency by stage, log scale.
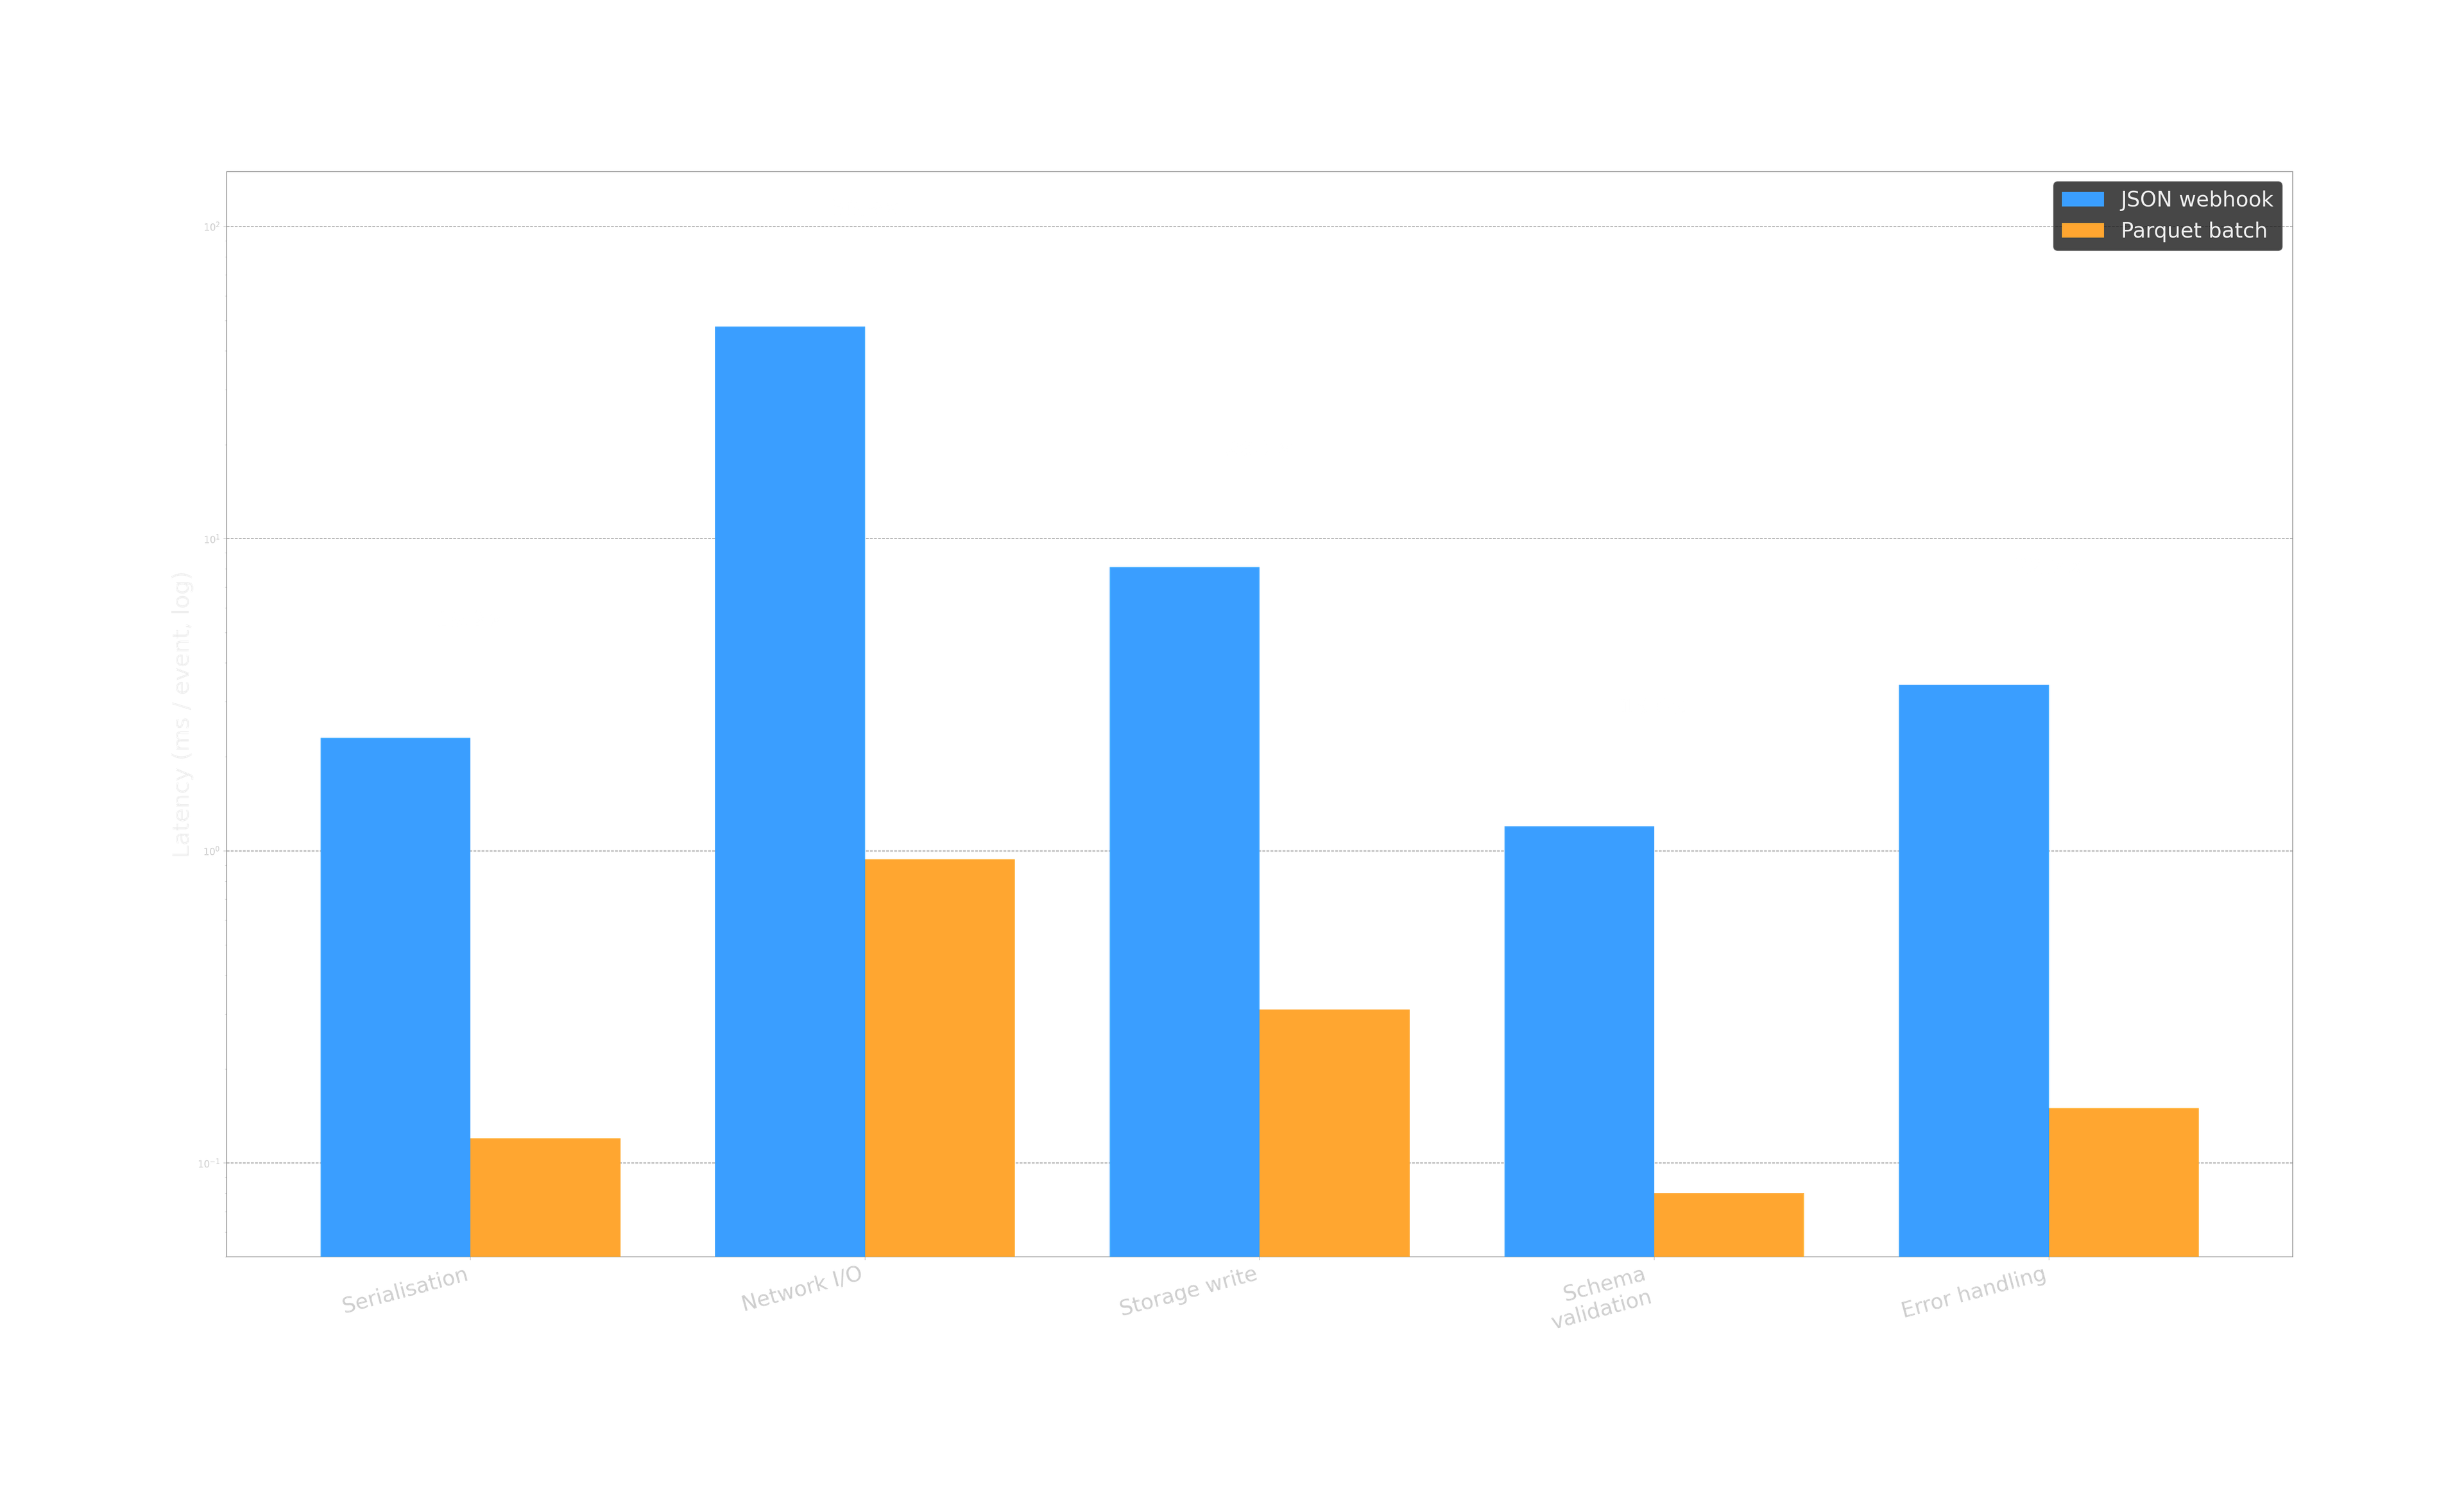
The improvement factor is annotated above each pair. Network I/O is the dominant cost in the JSON path and the one most fully eliminated by batching.
Scaling behaviour
We swept daily event volume from 1M to 100M:
- The JSON path degrades non-linearly beyond ≈25M daily events (connection-pool exhaustion, retry overhead, storage throttling).
- The Parquet path scales linearly through 100M daily events. The 8:1 compression ratio holds across the range.
The reliability angle here matters as much as the performance angle. At growth volumes the JSON pipeline stops having a steady state at all, while the Parquet pipeline retains one.
How the Producer-First Model Changes Recovery, Schema Enforcement, and Query Consistency
The two experiments address complementary failure modes. Putting them side by side:
Table 6: Reliability dimensions before and after.
Dimension | Before | After (A + B) |
|---|---|---|
SLA predictability | Run-to-run variance dominated by Azure LIST latency drift | Discovery is O(daily partitions); jitter irrelevant |
Backfill cost | Full prefix re-walk per backfill | Kafka offset reset; processed in time-windows |
Schema evolution | Manual schema for FulfillmentResults; mixed events per folder | JSON Schema enforced at decode; Delta schema evolution downstream |
Failure recovery | 15–45 min, manual snapshot mgmt | 3–8 min, automatic via Delta + Kafka offsets |
Data freshness | 6–8 h end-to-end | 5–10 min end-to-end |
Query consistency | Per-event JSON ⇒ frequent re-parse; cross-table joins expensive | Delta tables in Unity Catalog; Z-ordered; single source of truth |
Recovery via replay rather than rescan. The recovery behaviour is where the reliability difference is most visible. With Auto Loader on a per-order layout, "redo yesterday" means walking 130k+ folders again, and the time it takes is a function of how Azure's listing service performs that night. With Kafka offsets it means resetting a consumer group to 24h ago and letting it stream forward, and the time it takes is a function of throughput.
Schema enforcement. JSON-on-blob is schema-on-read. That sounds flexible until a producer adds a field mid-quarter and a downstream dashboard silently breaks. Validating against a registered JSON Schema at decode time, and enforcing Delta schema in Unity Catalog on the read side, removes that class of incident.
When the Producer-First Reliability Model Applies
This approach applies to any event-driven analytics pipeline with the following shape: events are produced at high volume per distinct business object, files land in object storage via polling-based discovery, and ingestion frequency is scheduled rather than streaming-native. The interventions described here — date-partitioned layout and producer-side Parquet aggregation — are not optimisations to apply after the fact. They are structural decisions that set the cost and reliability envelope for every downstream consumer, for as long as the data lives.
This approach does not apply where pipelines use push-based file notification (such as Azure Event Grid with Auto Loader notification mode), where event volumes per object type are low enough that per-entity folder counts remain in the thousands, or where a streaming-native query engine (such as Flink) already handles discovery differently.
Implementation: How JSON Becomes Parquet
The architecture of Kafka topic per object type, batched columnar Parquet on object storage, Auto Loader feeding Delta, is delivered by a small Rust consumer that runs alongside the EVA application pods, one instance per customer namespace. The conversion path is direct: JSON → Arrow → Parquet, with no intermediate serialisation format and no separate compaction step.
Figure 4: Storage required as a function of daily event volume.
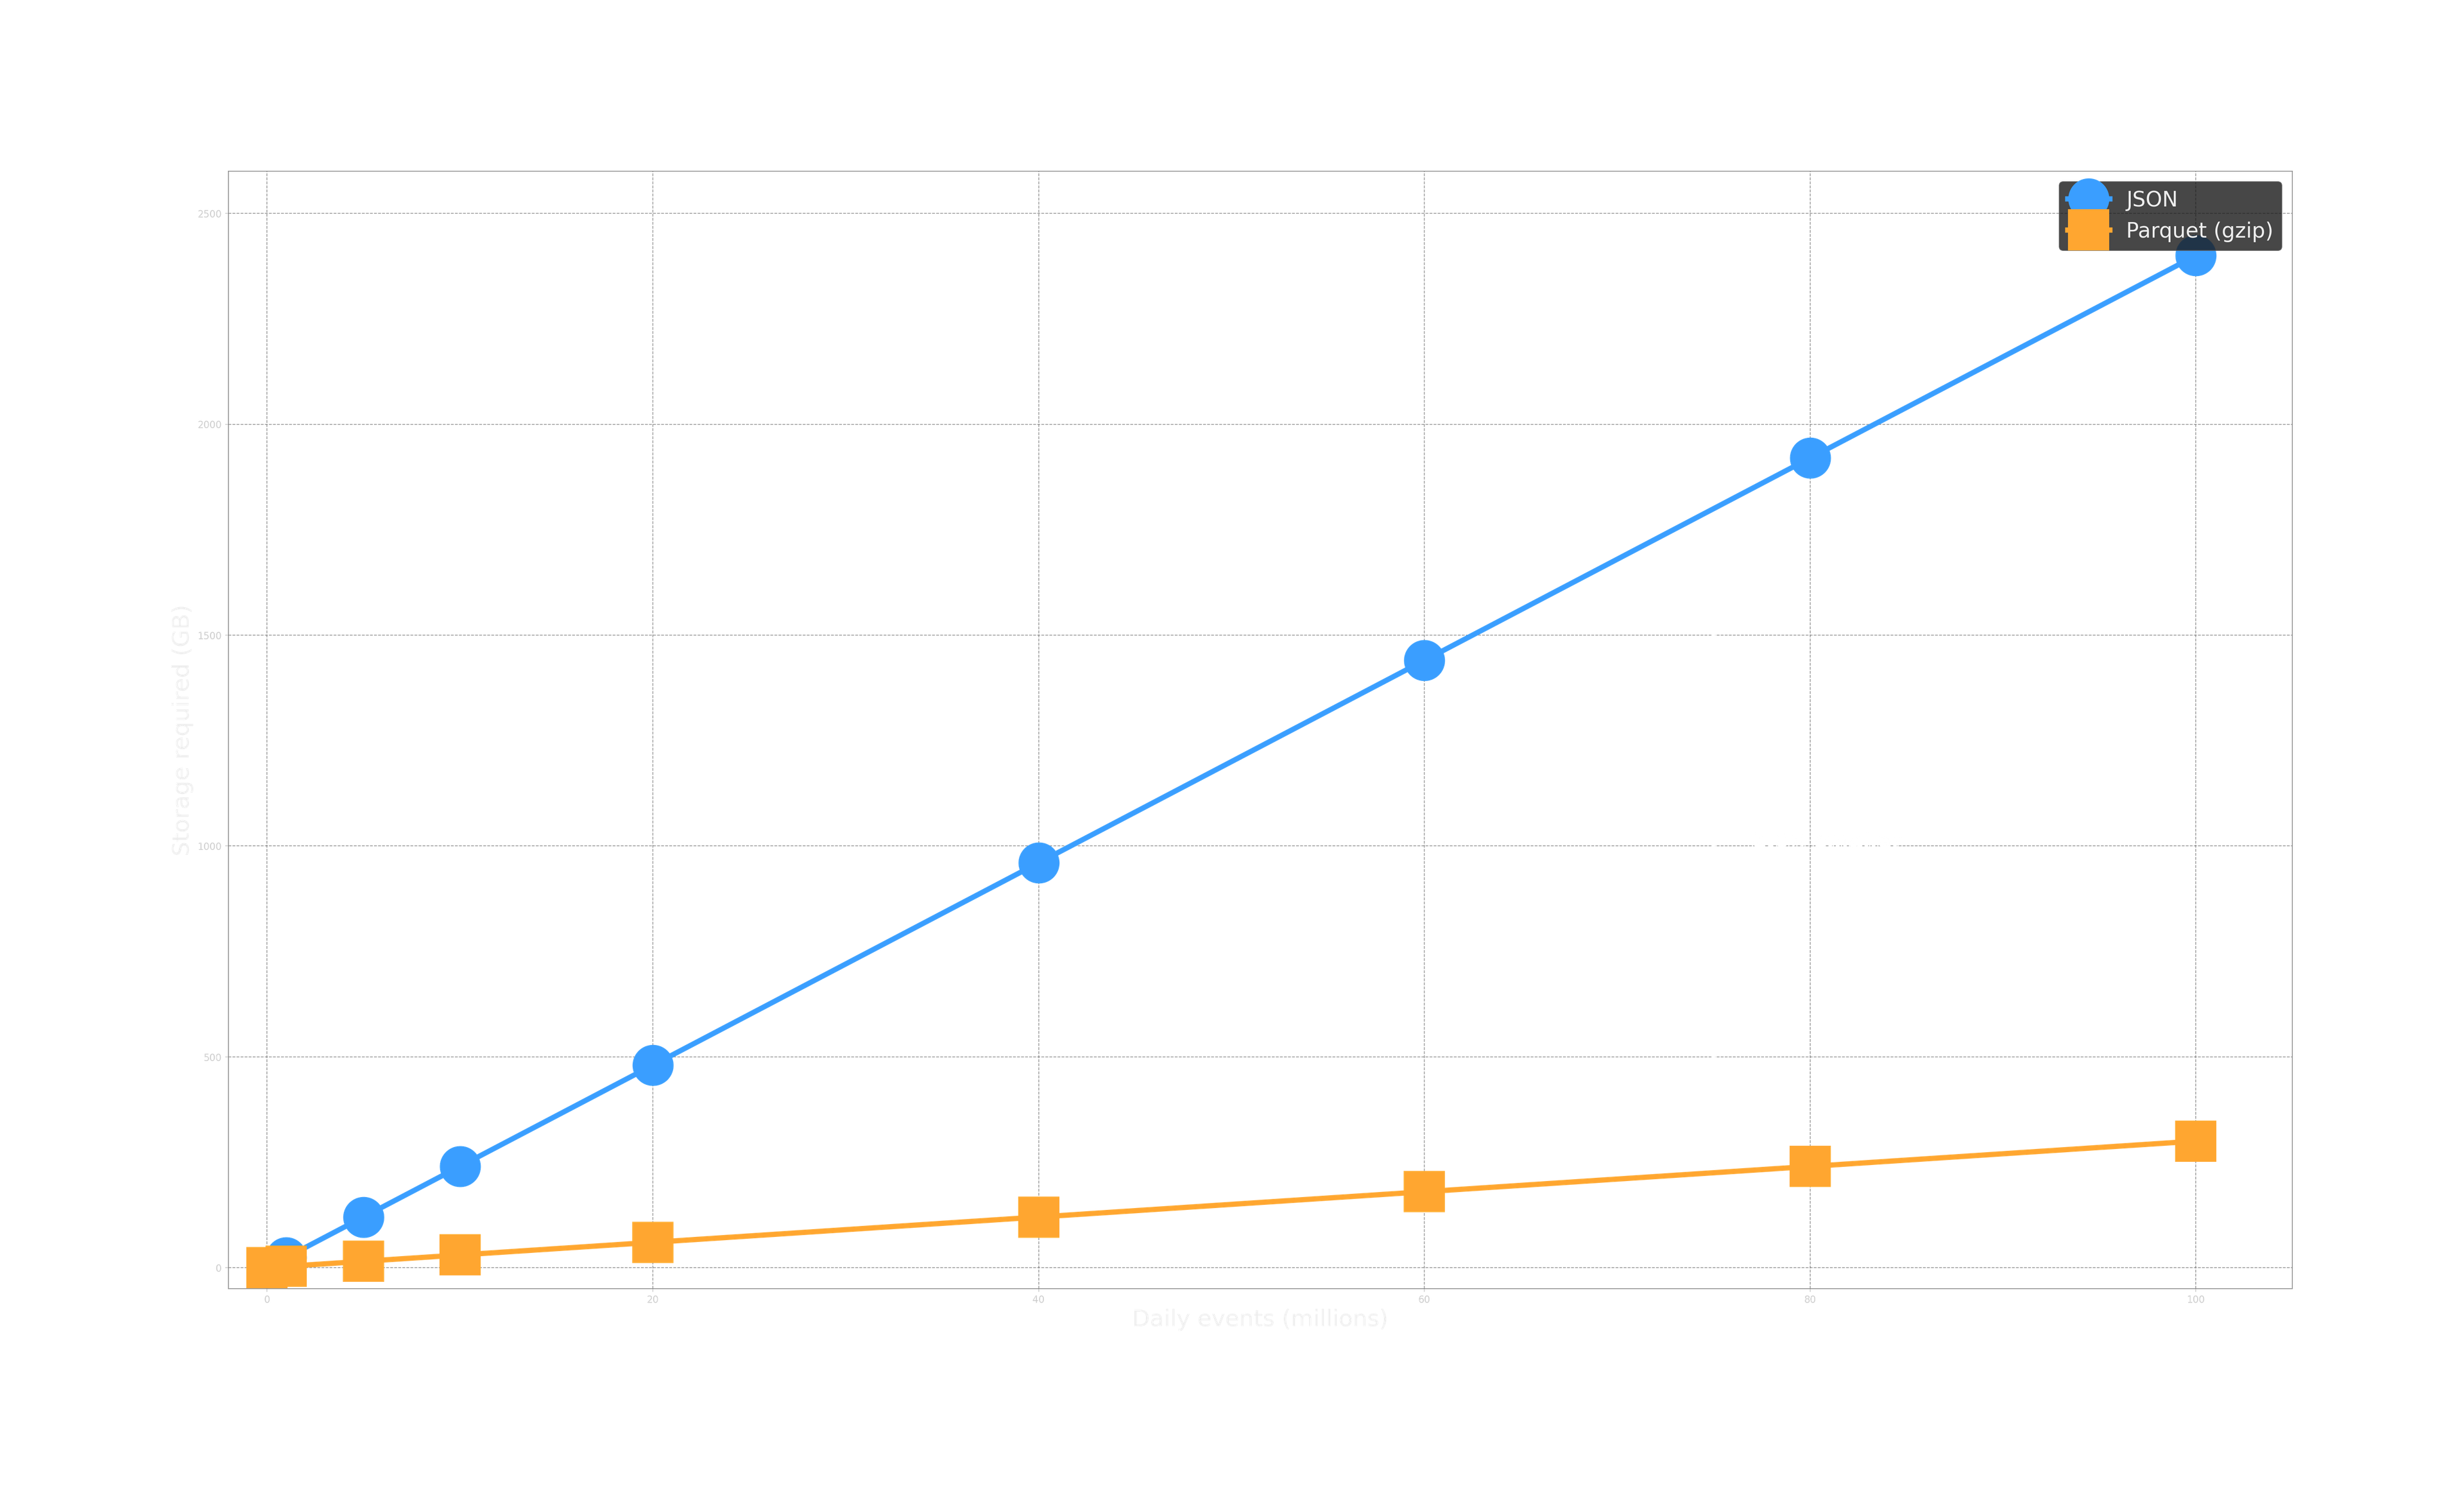
Both pipelines scale linearly; the slope ratio (8.0×) is set by columnar compression and holds across the swept range.
Figure 5: Relative monthly cost reduction by category at the 10M daily-events operating point.
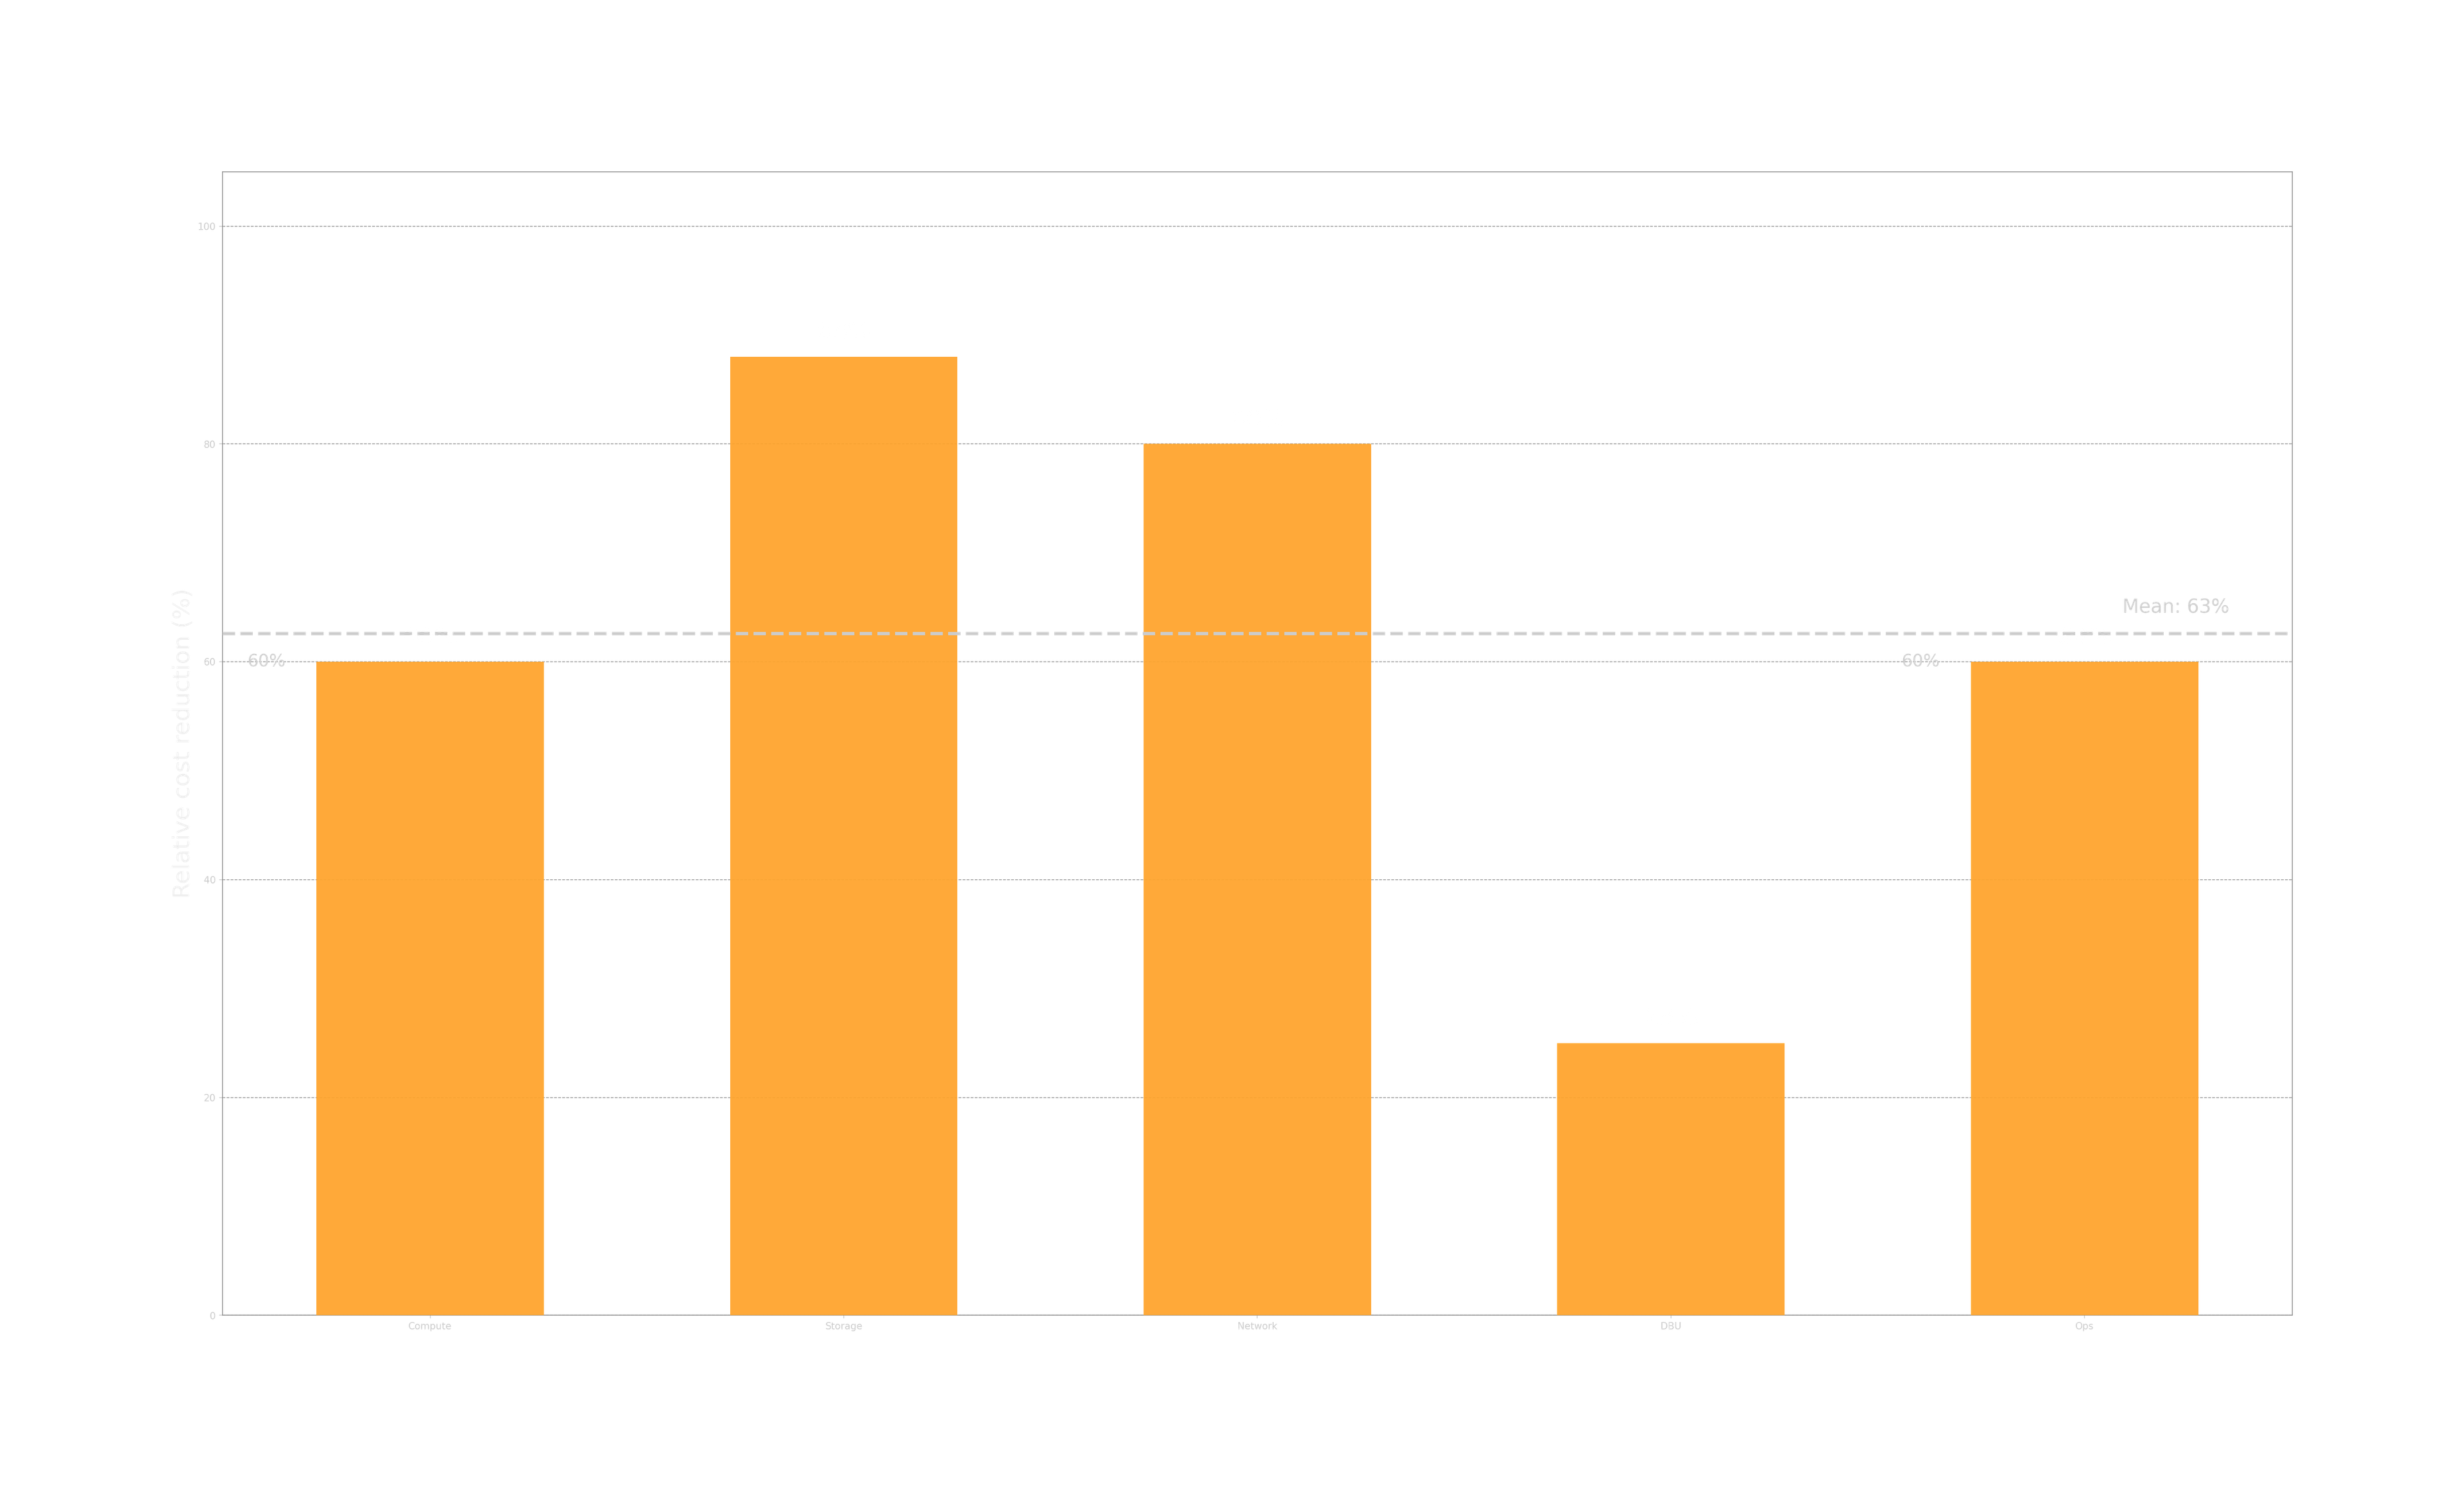
Storage shows the largest reduction (driven by columnar compression); Databricks DBU shows the smallest, because batched ingestion still uses the same Auto Loader stream. Absolute monetary values are intentionally omitted.
Pipeline at a Glance:
Figure 6 shows the conversion pipeline inside a single consumer instance. Messages from Kafka are decoded into Arrow, buffered per object type, then date-split and written out as Parquet to every enabled storage target. Messages that fail decoding are sent to a per-topic DLQ with structured error headers. Two out-of-band feeds drive the runtime: Schema Registry supplies the JSON Schemas that become Arrow schemas, and an internal Config API supplies the storage-target list and the lifecycle state.
Figure 6: Consumer architecture.
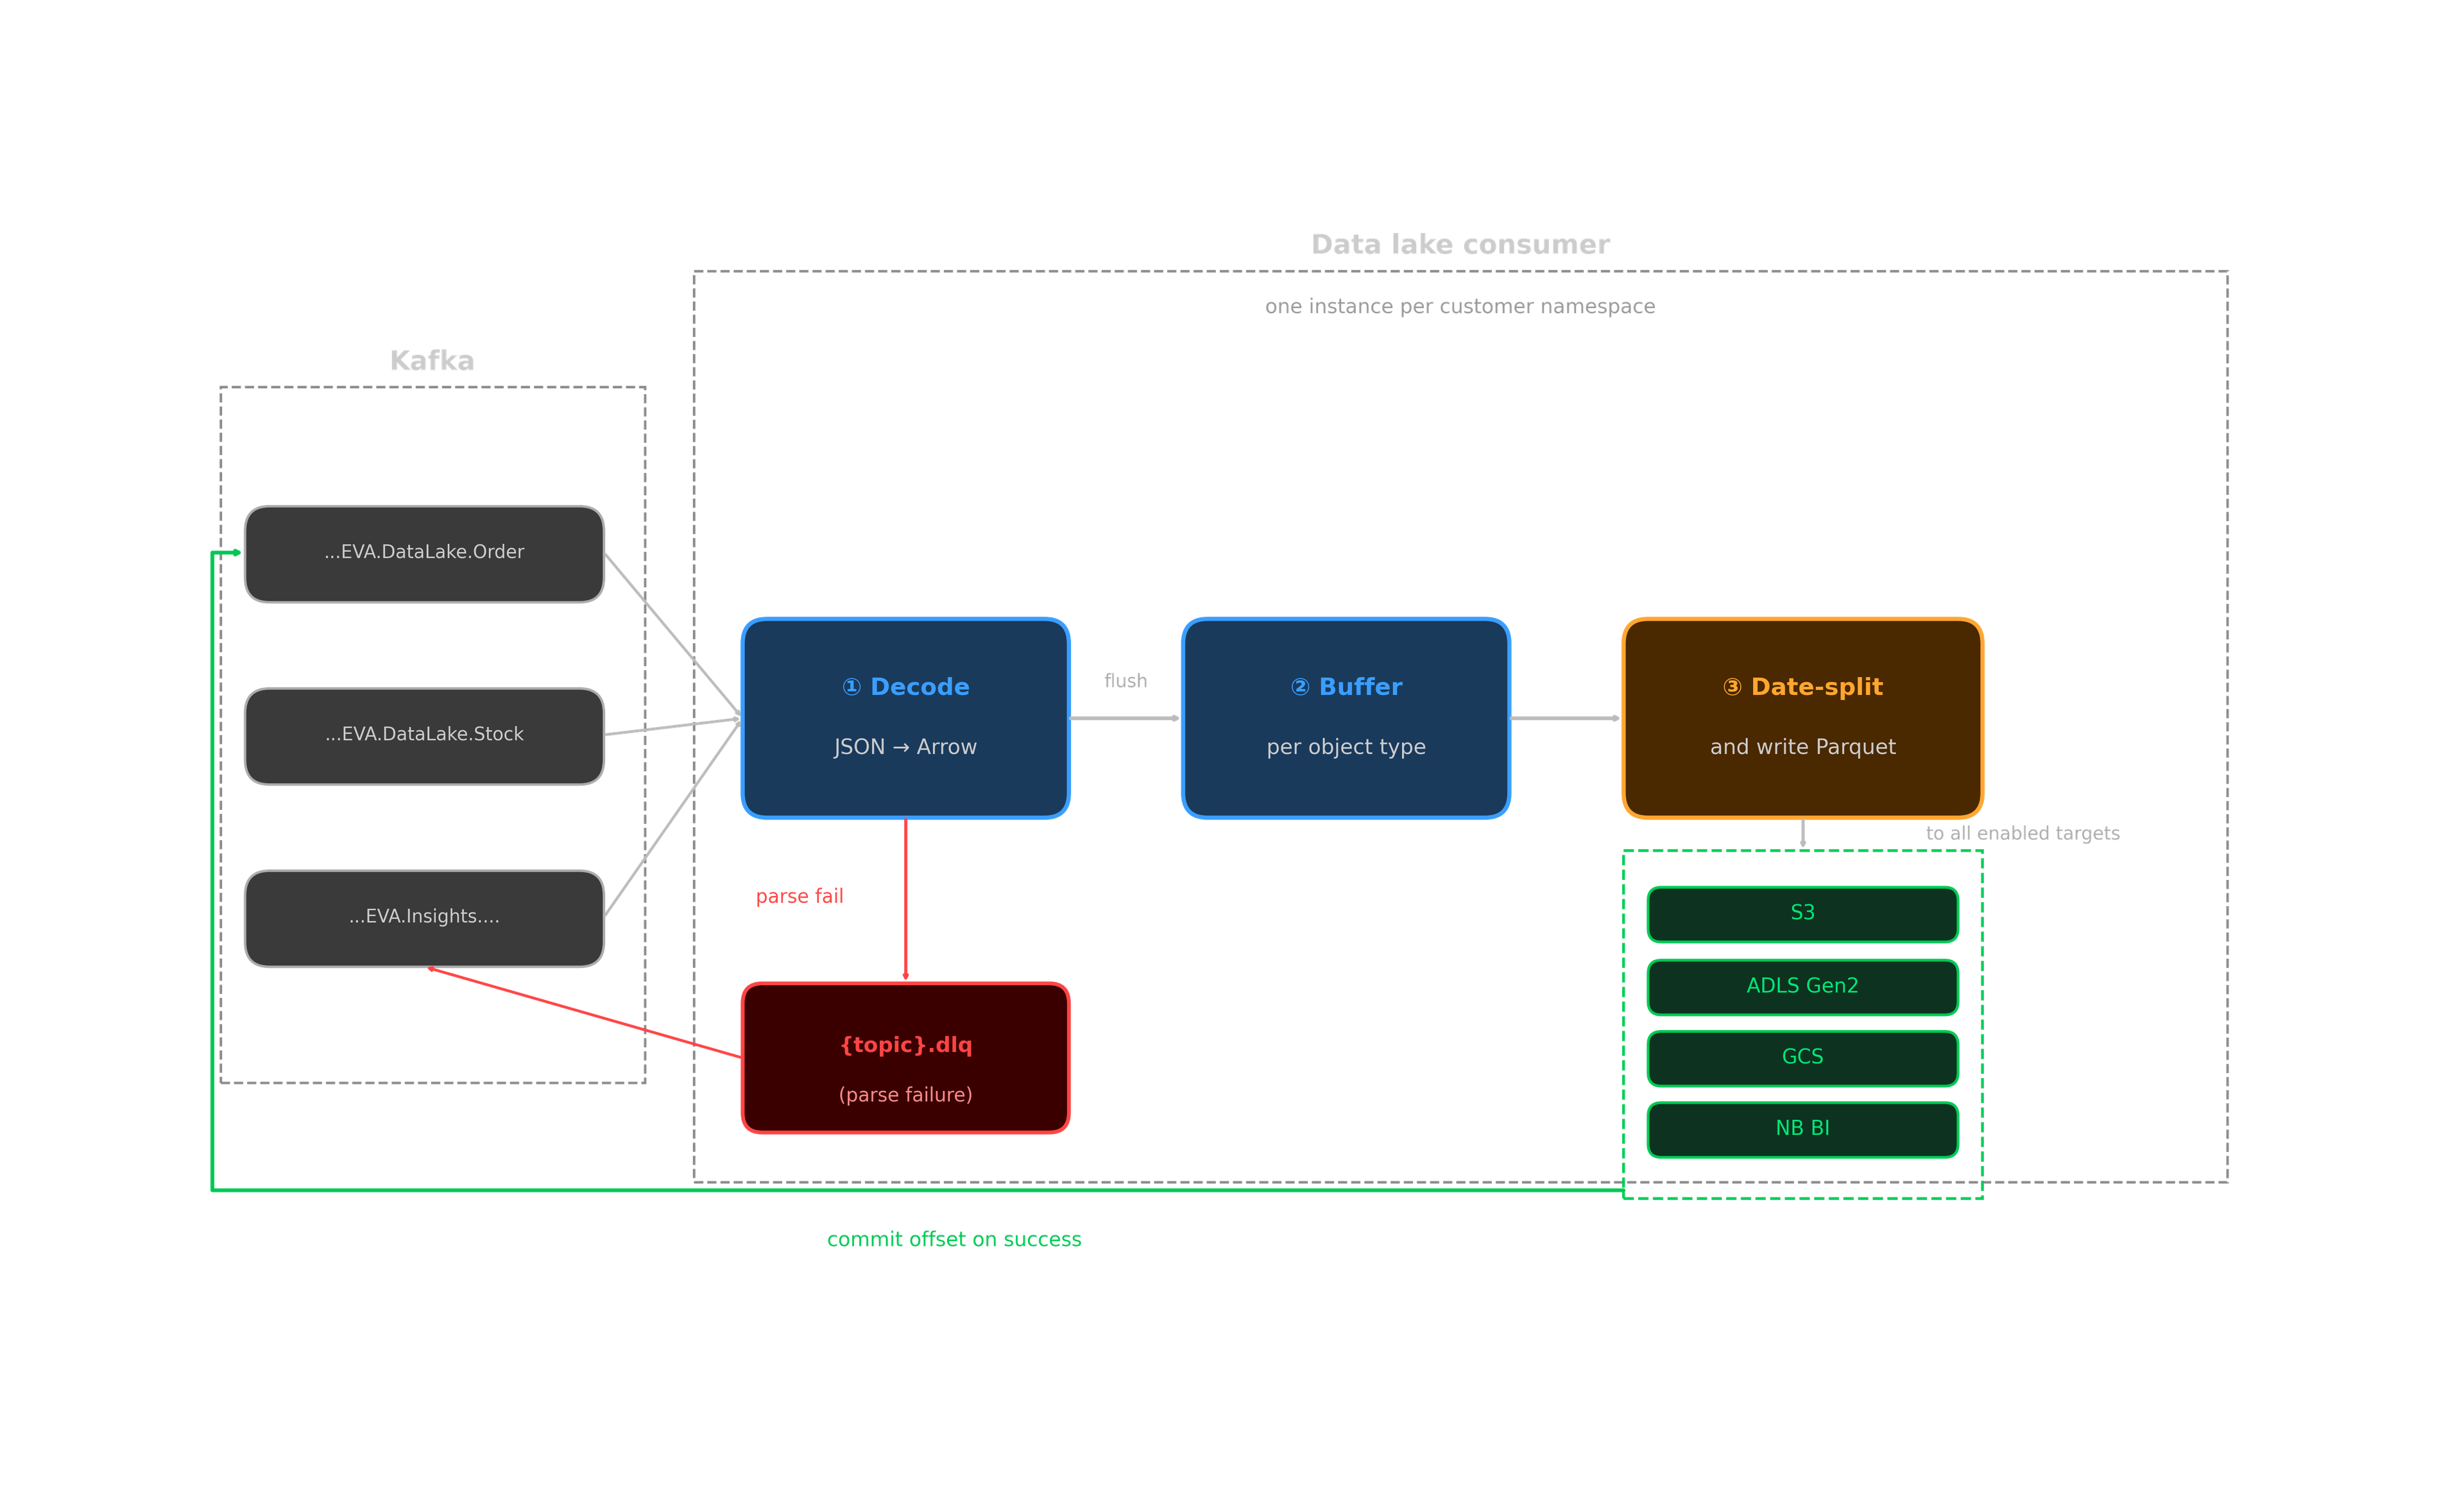
Kafka topics (left) feed a decode stage; on success the typed records are buffered per object type and flushed periodically to a write stage that splits batches by date and encodes them as Parquet. The Parquet files are uploaded to every enabled storage target, and Kafka offsets are committed only after every target has acknowledged the upload. Parse failures are routed to a per-topic DLQ. The Schema Registry feed and the runtime configuration feed are omitted from the diagram for clarity.
Stages in Detail
Topic and family routing. Topics carry a namespace, a family marker, and an entity name. There are two families: customer data and New Black internal BI data. Each family is handled by its own runner instance and writes to its own set of storage targets, so a misconfigured customer target cannot leak internal BI data and vice versa.
Schema source. Arrow schemas are derived from JSON Schemas fetched from Confluent Schema Registry and refreshed on a configurable interval (default one hour). The mapping resolves $ref, allOf, and nullable type unions before producing Arrow types:
Table 5: JSON Schema to Arrow type mapping.
Required fields are non-nullable; the rest nullable. Field order is sorted to keep the resulting Parquet schemas deterministic across runs.
JSON Schema | Arrow type |
|---|---|
string | Utf8 |
string + date-time | Timestamp(Millisecond, UTC) |
string + decimal | Decimal128(38, 8) |
string + uuid | Utf8 |
integer | Int64 |
number | Float64 |
boolean | Boolean |
object (with properties) | Struct(...) (recursive, ≤10) |
array (with items) | List(...) (recursive) |
Schema evolution is additive at the file level: a new field appears in next-cycle files only; older files simply lack the column. Removed fields become null in new files. Unknown fields in messages are silently dropped between refreshes (no data loss, no crash). Breaking changes (type swaps, renames) require coordination.
Decode. JSON bytes are parsed into typed records using the cached Arrow schema. Parse failures are routed to a DLQ topic alongside structured error metadata (source topic, partition, offset, error reason, failure timestamp). The consumer does not halt on individual bad messages.
Buffering and flush. Records are accumulated per object type, partitioned by Kafka partition, until either a count threshold or a time threshold is reached. The thresholds are configurable; the defaults target a few-thousand-record / hour-or-less granularity that keeps file sizes large enough for Parquet to be efficient and small enough for downstream Auto Loader to ingest within the BI window.
Date splitting at write time. On flush, each buffered batch is split by the event-time date carried in the payload before encoding. A single flush can land files in more than one daily partition. This step is what makes the consumer’s output layout identical to the per-date partitioning that Experiment 1 measured as the right one.
Parquet encoding and upload. The date-grouped batches are written as Parquet, GZIPcompressed, and uploaded to every enabled storage target. The output path follows the standard Hive convention: {folder}/{entity}/year=YYYY/month=MM/day=dd/{file}.parquet The Kafka offset range covered by each file is encoded into the filename. Backfills and crosschecks therefore use the filename as a replay key, with no directory listing required.
Delivery semantics. The consumer is at-least-once. Kafka offsets are committed only after the Parquet file has uploaded to every enabled storage target. On crash or restart, some messages may be reprocessed; deduplication is handled at the silver layer.
What This Gives BI
The implementation choices line up directly with the reliability properties that motivate the paper:
- Date partitioning at write time. Date splitting happens in the writer, not in a downstream Spark job. Auto Loader sees year=YYYY/month=MM/day=dd/ from day one, so the discovery cost stays O(daily partitions): the Experiment 1 result by construction.
- No JSON intermediate on disk. Parquet is the landing format. The small-file problem from the JSON-webhook baseline does not appear here.
- Schema validation at decode. Bad payloads end up in {topic}.dlq with structured error metadata, instead of polluting the bronze table.
- Backfill keyed by offset range. Each Parquet filename encodes its Kafka offset range. A backfill or a cross-check reads the specific files covering the window of interest, with no need to replay Kafka end-to-end.
- One consumer per customer namespace. The failure blast radius stays bounded. A noisy customer cannot stall another customer's BI.
Migration Path
How to adopt the Producer-First Reliability Model: migrate the two interventions independently, running old and new paths in parallel until parity is confirmed.
- Run both exports in parallel. The legacy per-order export keeps writing as it does today, and the new export (per-date paths for Intervention A; Kafka-fed Parquet for Intervention B) writes alongside it. Nothing is decommissioned at this stage.
- Observe data parity. For every object type we compare the two pipelines at the table level: row counts per day, distinct primary-key counts, and a column-hash digest on the overlapping schema. The migration step only completes for an object once parity has been observed for a sustained window (we use seven days as the default acceptance window). Discrepancies are diffed at the message level using the Kafka offset range encoded in each Parquet filename.
- Switch the writers to the tables. Once parity holds, the Delta tables that BI consumes are repointed from the legacy ingestion path to the new one. The legacy export keeps writing for one more parity window so a side-by-side reference remains available if a downstream issue surfaces.
- Switch the consumers. Dashboards, semantic models, and ad-hoc queries are pointed at the new tables. Once consumer-side checks have soaked, the legacy export is decommissioned for that object type.
The migration is per-object-type, not all-or-nothing. Orders, Stock mutations, Financial events, and the General Ledger are the natural starting set. The first three are the highest-volume streams (≈67% of event volume) and so deliver the largest reliability win first. The General Ledger is included in the same batch even though its raw event count is lower, because each ledger object is large, the schema is wide, and downstream finance reporting is sensitive to gaps and reorderings. Mishandling it during migration is expensive in a way that mishandling Orders is not, so it gets the same parallel-publish, parity-window treatment from day one. The remaining types follow in batches as parity windows close.
Conclusion
The Producer-First Reliability Model rests on a single finding: Ingestion cost in event-driven data lakes turns out to depend more on how the data is laid out and delivered than on how much of it there is. Experiment 1 shows that re-partitioning alone takes a 71-hour ingestion run down to under an hour on identical inputs. Experiment 2, run in our development and test environment, shows that moving from per-event JSON to Kafka-fed batched Parquet adds further gains in storage, throughput, query latency, error rate, and recovery time. The run-to-run variance disappears with it.
The bigger point is that how events are aggregated and how they are written down at the source is the decision that sets everything downstream. Batching events before writing, using a columnar landing format, and partitioning by time instead of by business object are not optimisations to apply later. They are producer-side properties, and they decide what every consumer has to do for as long as the data lives.
Making these decisions well at the start saves data teams time, since fewer hours go into chasing slow ingestion runs and reproducing parity diffs. It saves resources, because the compute footprint shrinks and the operational overhead around dashboards and recovery shrinks with it. It saves money, because both of those flow into the bill. And it improves reliability — the gain that does not appear on a cost report at all but shows up as fewer incidents to diagnose.
For a BI lake to grow with the business rather than push back against it, the unit of work has to stop being "one HTTP request per event, one folder per object." The experiments above quantify what we expect to gain when we make that change in EVA's environment, and the same pattern applies to any event-driven analytics pipeline with the same shape.
Appendix: Reproducibility Notes
Experiment 1. The new container was populated by an Azure azcopy of every blob under the orders prefix, with target paths rewritten to orders/<year>/<month>/<day>/. Exactly the same backfill notebook was pointed at the new container. Discovery time was measured from the first listBlobs call to the last; schema inference and Delta write were measured from Spark UI stage timings.
Experiment 2. The 30-day evaluation ran in our internal development and test environment, fed from a single tee inside that environment so both pipelines saw identical event streams. "Error rate" counts events lost or arriving corrupt at the destination table, not infrastructure-level retries.
Caveats. Experiment 1 numbers are measured on a single storage account in a single region (West Europe). Azure LIST latency does vary across accounts. Experiment 2 was run in a development and test environment that is not a like-for-like replica of production. Hardware sizing and the network path will be different in the customer-facing deployment. The relative behaviour of the two pipelines should carry over, but the absolute magnitudes need to be confirmed in production before they are quoted to stakeholders. Absolute monetary cost values are intentionally omitted from this paper. All cost-related figures show relative reductions only.